Just How Accurate Are The EIA’s Predictions?

The EIA recently published the February edition of their Short-Term Energy Outlook. If you follow this month to month, and we do, you will notice their prognostications change a little every month. And over several months those small changes can add up to some rather dramatic changes. Nevertheless, below are several charts with their current oil production projections.
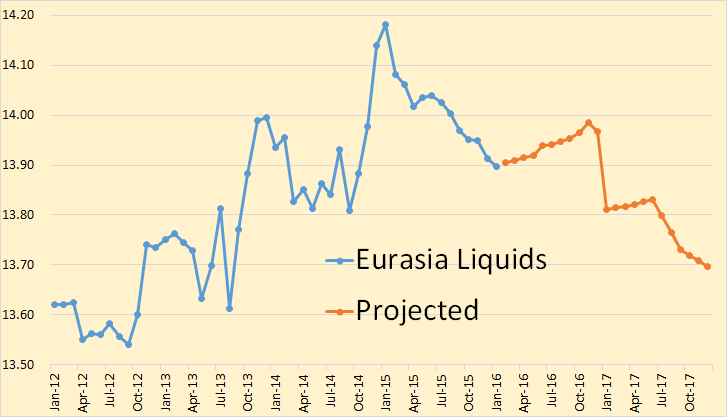
The EIA STEO only gives monthly data for total liquids. All C+C data is quarterly and annually. The monthly projected data begins in February 2016. Projections for quarterly and annual data begins January 2016.
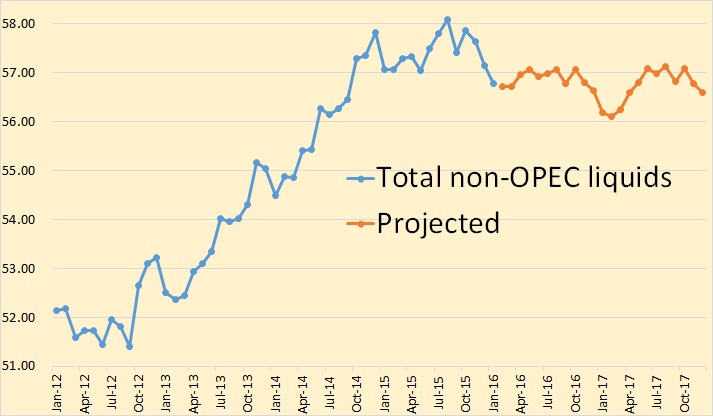
The EIA says Non-OPEC total liquids dropped .5 million barrels per day in December and another .36 mbd in January. But then, other than another short drop in the first quarter of 2017, they see things leveling out for the next two years.
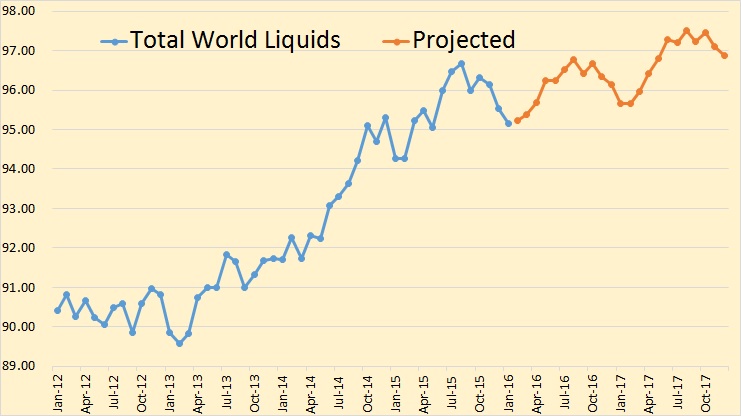
For the total world, the EIA expects far better production numbers than just for Non-OPEC. They expect new highs to be reached in 2016 and again in 2017.
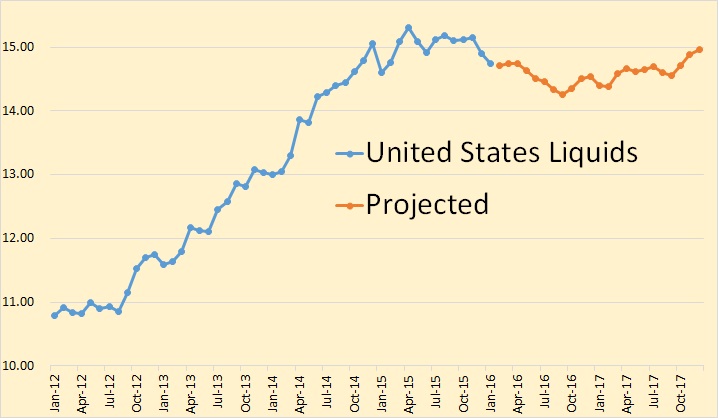
They see US total liquids dropping in 2016 then they begin a slow rise through 2017, but not overtaking the peak in 2015.
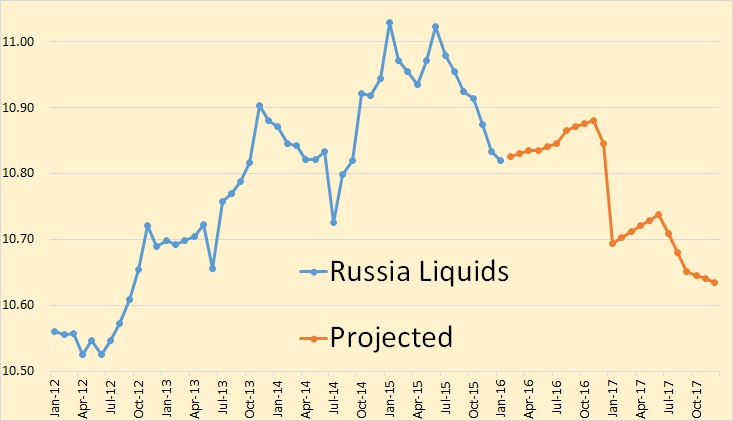

Apparently the EIA thinks Russia has had it. They see a drop in December 2016 then a huge drop in January 2017. We have no idea why. However the scale here makes the decline seem greater than it really is. From January 2015 to December 2017 the decline is only 400,000 barrels per day.
Adding the other FSU nations to the mix, mostly Azerbaijan and Kazakhstan, only exacerbates the decline, making it half a million bpd between January 2015 and December 2017.
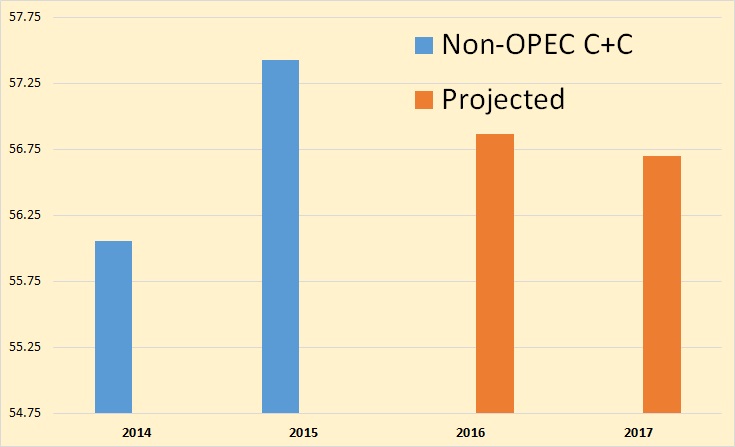
Looking at just Crude + Condensate you get a better picture of what the EIA really expects in the next two years. They expect Non-OPEC C+C to drop 580,000 bpd in 2016 and another 170,000 bpd in 2017 for a total of 750,000 bpd over the two years.
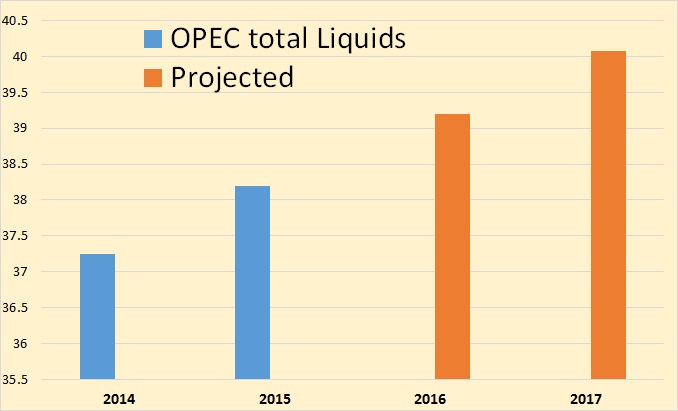

They are expecting far better things out of OPEC's gang. They have the OPEC gangs total liquids up 1,010,000 barrels per day in 2016 and another 870,000 bpd in 2017. They do not project OPEC C+C.
But taking a closer look at their US Projections:
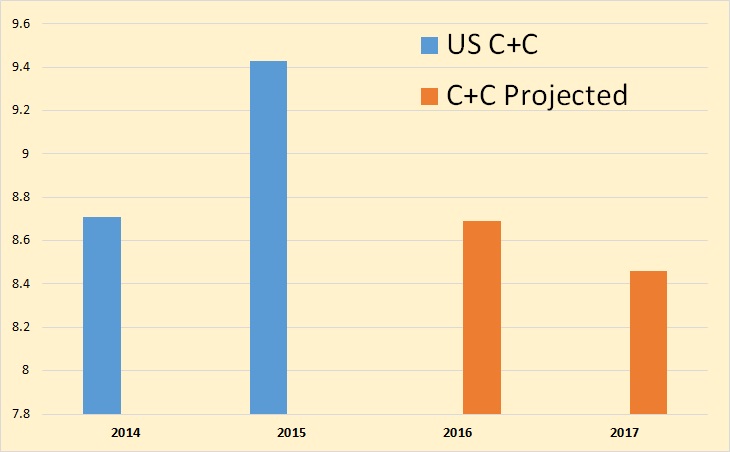
The EIA expects US C+C to drop 740,000 barrels per day in 2016 and another 230,000 bpd in 2017 for a total decline over two years of 970,000 barrels per day.
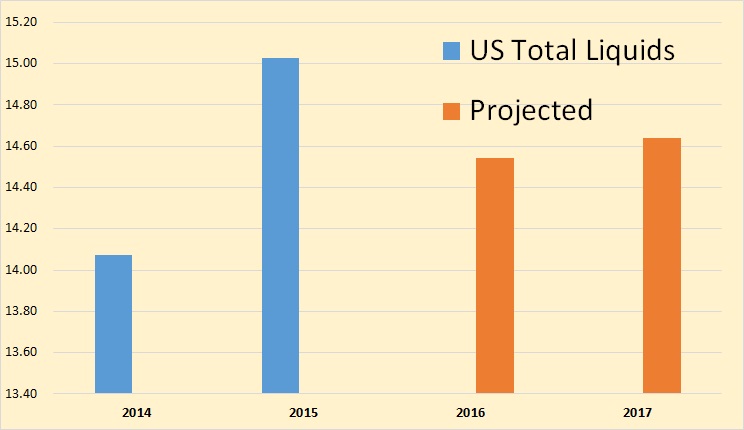
However they have US total liquids faring much better then just C+C. They have total liquids declining by only 490,000 barrels per day in 2016 and increasing by 100,000 bpd in 2017.
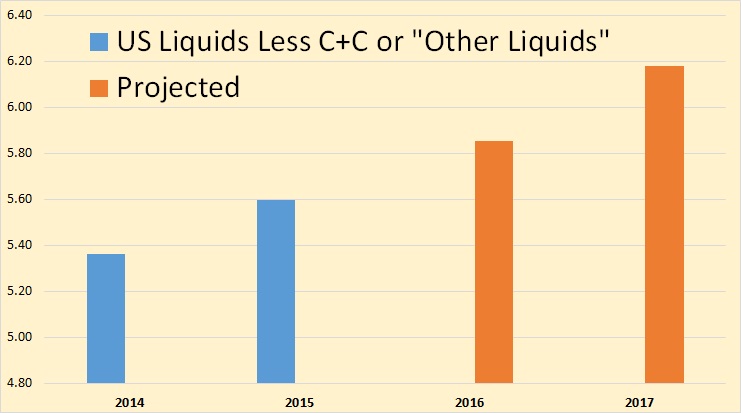 |
What this means is that US “Other Liquids”, that is NGLs, biofuels and refinery process gain must show a very impressive gains while everything else is going to pot. They show other liquids increasing by 250,000 bpd in 2016 and another 330,000 bpd in 2017.
Most of this increase has to come from NGLs as biofuels are only a minor input and refinery process gain pretty much follows C+C consumption. But…
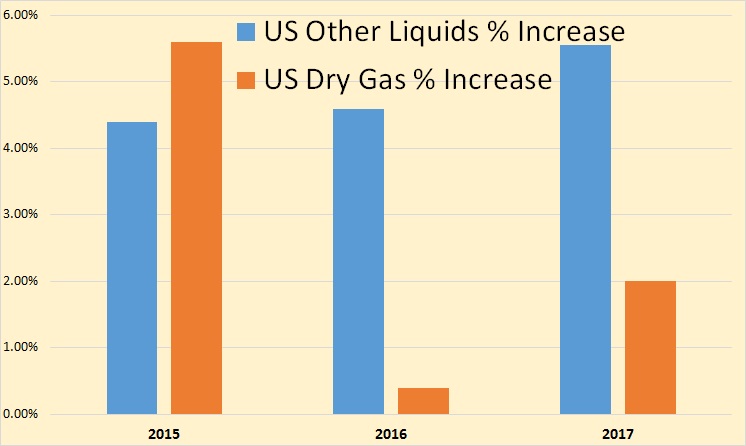
Using their projections for Dry Gas production we find that gas production increased more than other liquids increased in 2015. However they say gas production will increase by only .4 percent in 2016 while other liquids increase by 4.6 percent, and a similar story in 2017 though not quite as dramatic.
Bottom line: We find the EIA’s past production data very accurate. However their projections appear to be pretty lame. This observation is proven out by the fact that those projections are constantly changing. Also, those “Other Liquids” projections seem to make no sense whatsoever. It appears to be mostly a fudge.
But the very biggest problem with the EIA’s projections are with OPEC. That is because it is not a projection at all but an estimate of what will be needed to meet world demand. That is they estimate Non-OPEC production, then they estimate world demand, and the difference between the two will be the “Call on OPEC”. That is, they will simply expect OPEC to make up the difference, whatever that difference may be.
Lately, however, OPEC seems to be producing a lot more than their call asked them to. That is, they appear to be ignoring their call. And they will likely do likewise when they are expected to produce more to meet demand. They are all currently producing flat out and if there is a call on them to produce more, it will very likely go unanswered.
WE thus expect the “Call on OPEC” is a running joke between OPEC nations.

______________________________________________________
No comments:
Post a Comment